Tag Archives: PowerBI

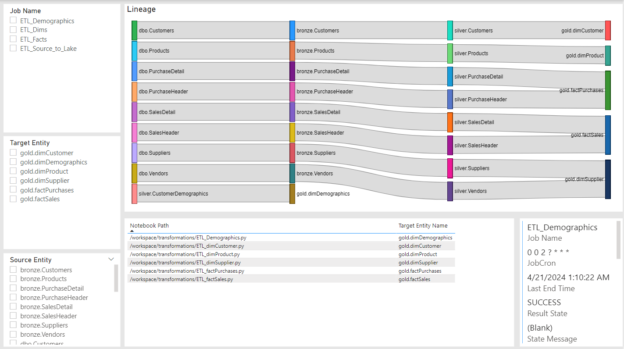
Poor Man’s Data Lineage and Classification in Power BI with Sankey Charts

There’s a huge need in any data driven organization to know where data is coming from, how it got there, and other characteristics of it. There are a variety of tools at our disposal that can do a great job of this and in most cases do it automagically. But what if you didn’t want to pay to use Purview or Unity Catalog and just needed something either to get the job done or as a proof of concept, to show business value, that would lead into the usage of one of these tools? Well you might not know, but Power BI has a free market place item that is great for that: Sankey Charts.

Continue reading

Buying a South Denver Home Based on Power BI Insights

Two years ago I got tired of paying rent and decided to dive into homeownership because of the insights I saw in a similar dashboard to the one in this post. What I saw was purchasing a home in Englewood was a sound investment because it was a neutral to almost a buyer’s market in the southern part. I bet on the southern expansion of Broadway as people found living in Platt Park/Wash Park became more and more unaffordable as well as local investments in the betterment and appeal of Englewood driving northern expansion along Broadway.

It’s inevitable that the South Broadway strip will eventually become more walkable and different than the times of even a decade ago, where it was void of any stores worth visiting and restaurants that were any good; and that’s exactly what the data was showing me. Now I’m here two years later, engaged, and wanting to purchase another home. What will the data show this time?

Continue reading