
There’s a huge need in any data driven organization to know where data is coming from, how it got there, and other characteristics of it. There are a variety of tools at our disposal that can do a great job of this and in most cases do it automagically. But what if you didn’t want to pay to use Purview or Unity Catalog and just needed something either to get the job done or as a proof of concept, to show business value, that would lead into the usage of one of these tools? Well you might not know, but Power BI has a free market place item that is great for that: Sankey Charts.
At my current job we’re in the process of implementing both tools mentioned above. What I wanted to do before diving into these projects was to start to collect the information about our lineage, jobs, and classifications of our data beforehand. These would intended to be reused later once either or both Unity Catalog or Purview were implemented. In both software’s cases they try their best to auto discover all of your data elements and relate them to each other. In the case of Unity Catalog, all elements of a piece of data need to be referenced in your catalog or created using Databricks. This can become cumbersome to manage everything in that place, because face it, we don’t typically use a single platform for every data movement. As for Purview, I believe it does a better job of this as well as allows you to manually edit lineages. But what if you wanted complete control over all lineages and did not want to rely on auto discover? This is where I wanted to start.
If you’ve built a half decent ETL process in any tools, you’ve hopefully metadata driven it. You probably have information about the sources of your data and watermarks to keep track of incremental loading. If you don’t this will not work for you, but if you do then you’re already in a good place to make this utility functionable.
I don’t want to get into too much detail, so I’ll highlight the key elements you’ll need at a minimum.
Entities
We refer to any data element as an Entity. This is because sources of data aren’t always tabular tables. Sometimes they are complex JSON from APIs. Sometimes they are flat files. You will hopefully have a table that keeps track of their attributes like Source Name, Target Name, Source Server, etc.
Watermarks
If you are doing any sort of incremental ETL process on large entities, you will more than likely not read the whole entity each time you load it. You will probably have some way to keep track of where you processed to the last time an extract was ran. We typically call these Watermarks.
Target Entity Sources
This mapping is not something you usually have in metadata. Although when I worked at National CineMedia, we abstracted our ETL all the way to this point and kept track of what sources were needed in a transformation process and loaded them into memory at runtime.
Anyway, what this table will be is key to the design of this tool. You will create the mappings from your Entities table of which Source Entities are used to create a Target Entity. In the example I will share, you can see various types of these.
E.g. Source database 1 table dbo.Vendors -> bronze.Vendors -> silver.Vendors -> gold.dimSupplier
In that case, three source to target mappings in this table. You can normalize this down to the unique keys of your entities or keep their system names from your Entities table for easier readability.
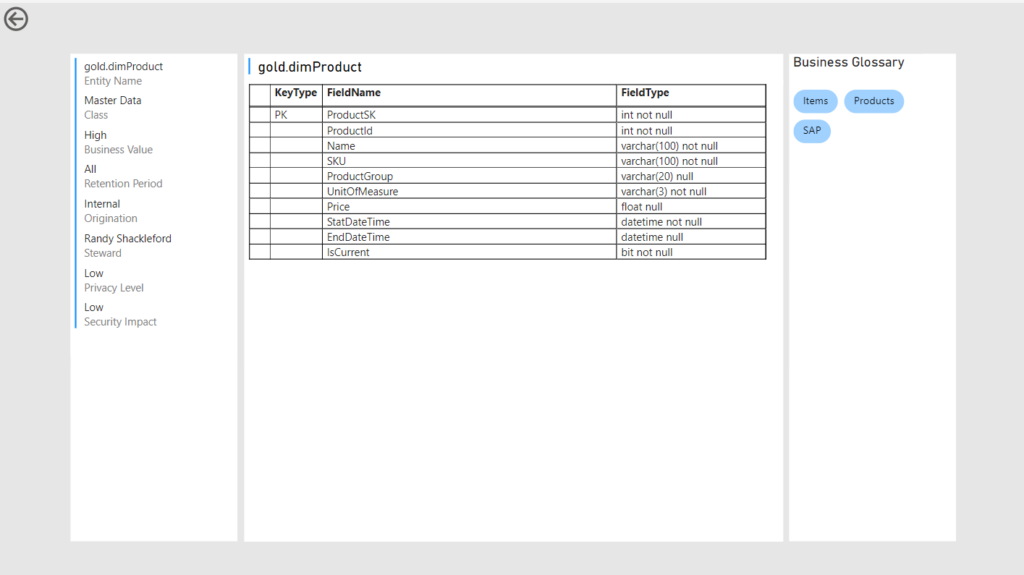
Entity Classifications
Again, most companies do not maintain these types of metadata unless they are somewhat data mature. Entity Classifications are attributes about your data such as did it come from internal or externa? What sensitivity is it? What value does it have? How long do you retain it?
In this sample, I’ve created a table with the most common classifications in it for each target entity.
Entity Tags
Tags are free form elements you put on your entities. They can be whatever you want and however many you need. I put some generic ones in the example to give you ideas of how to use them.
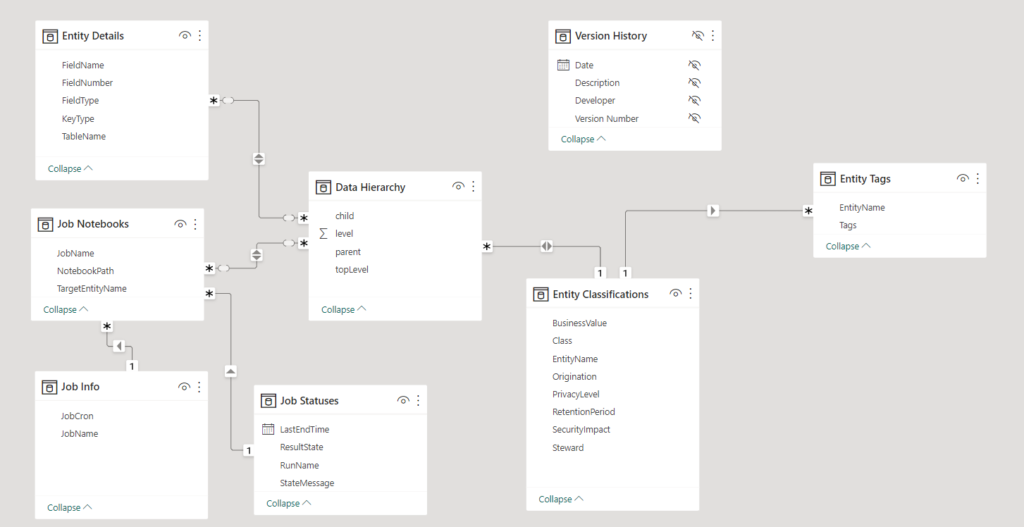
Once you have these foundational elements you can add anything else that might be related to them. In the case of what we implemented at Colas, we added a lot of information we collect from Databricks about the state of the jobs that run, the cluster sizing, scheduling, etc.
So how does it work?
The whole design of this tool relies on that you have built a valid chain of parent/child relationships in your Target Entity Sources table. If you’ve done that, then you can write a recursive CTE to create the hierarchy structure of how your entities roll up to the top target entity. In our case what’s in our dimensional model or gold lakehouse zone. The below code snippet creates three subqueries that are 1) Entities that are top level parents, 2) Entities that are both parents and children, and 3) Entities that are only children. By creating these three categories you can then recursively piece them together into a hierarchy.
drop table if exists #depObjs
create table #depObjs (
	child varchar(400),
	parent varchar(400)
)
insert into #depObjs (parent, child)
select distinct null as parent
, TargetEntityName as child
from (
	select j.JobName
	, jt.NotebookPath
	, concat(sel.TargetZone, '.', sel.TargetName) as SourceEntityName
	, concat(tel.TargetZone, '.', tel.TargetName) as TargetEntityName
	from dbo.TargetEntitySources ts
	join dbo.Entities sel
	on ts.SourceEntityId = sel.EntityId
	join dbo.Entities tel
	on ts.TargetEntityId = tel.EntityId
	join dbo.JobTargetEntities jt
	on ts.TargetEntityId = jt.TargetEntityId
	join dbo.Jobs j
	on jt.JobId = j.JobId
	where tel.TargetZone = 'gold'
) j
union
select TargetEntityName as parent
, SourceEntityName as child
from (
	select j.JobName
	, jt.NotebookPath
	, concat(sel.TargetZone, '.', sel.TargetName) as SourceEntityName
	, concat(tel.TargetZone, '.', tel.TargetName) as TargetEntityName
	from dbo.TargetEntitySources ts
	join dbo.Entities sel
	on ts.SourceEntityId = sel.EntityId
	join dbo.Entities tel
	on ts.TargetEntityId = tel.EntityId
	join dbo.JobTargetEntities jt
	on ts.TargetEntityId = jt.TargetEntityId
	join dbo.Jobs j
	on jt.JobId = j.JobId
) j
union
select TargetEntityName as parent
, SourceEntityName as child
from (
	select j.JobName
	, jt.NotebookPath
	, concat(tel.SourceZone, '.', tel.SourceName) as SourceEntityName
	, concat(tel.TargetZone, '.', tel.TargetName) as TargetEntityName
	from dbo.TargetEntitySources ts
	left join dbo.Entities sel
	on ts.SourceEntityId = sel.EntityId
	join dbo.Entities tel
	on ts.TargetEntityId = tel.EntityId
	join dbo.JobTargetEntities jt
	on ts.TargetEntityId = jt.TargetEntityId
	join dbo.Jobs j
	on jt.JobId = j.JobId
	where sel.EntityId is null
) j
;with cte_depObjs as (
	select p.child as topLevel,
	    p.child,
		p.parent,
		1 as level
	from #depObjs p
	where p.parent is null
	union all
	select r.topLevel,
		p2.child,
		p2.parent,
		r.level + 1 as level
	from #depObjs p2
	join cte_depObjs r
	on r.child = p2.parent
	where p2.child != p2.parent

)
select topLevel, parent, child, level
from cte_depObjs
option (maxrecursion 100)
Everything else in the semantic model relates to this table.
To use this utility, you can do a number of things:
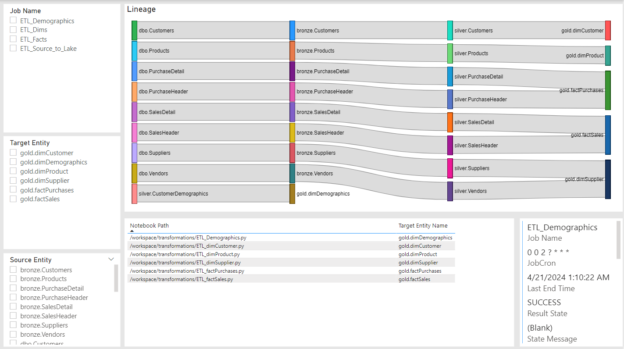
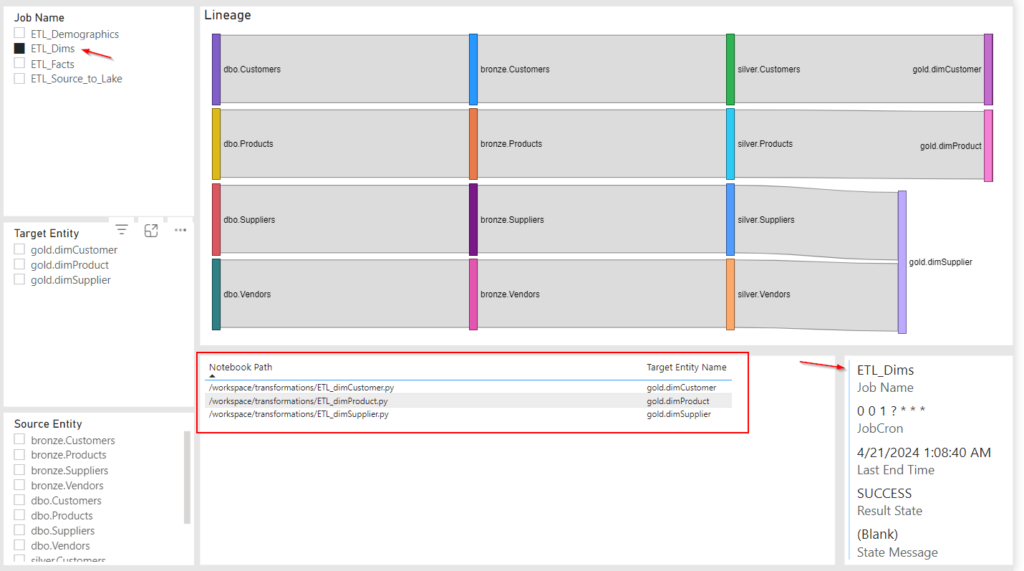
Filter by Job:
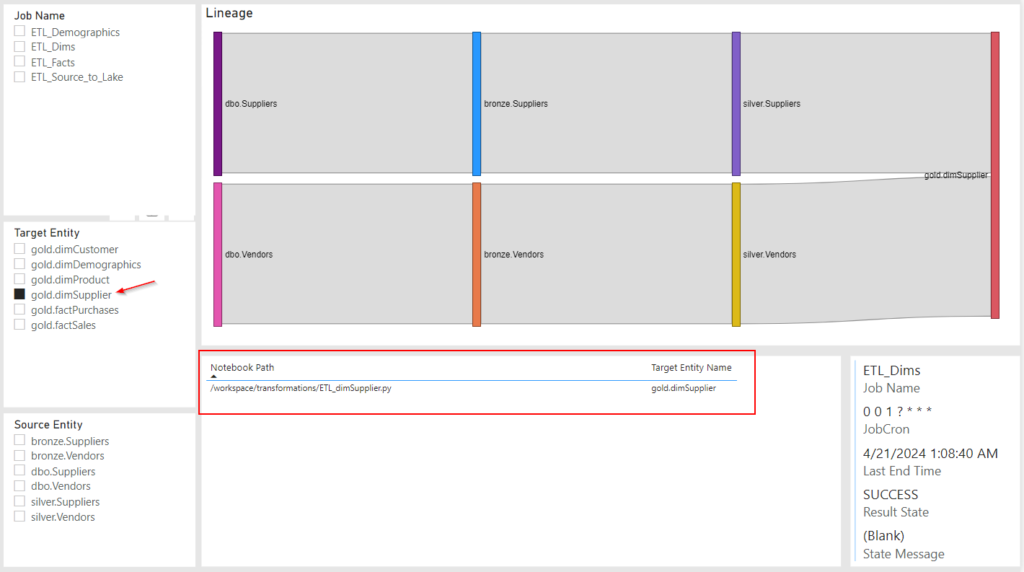
Filter by Target Entity:
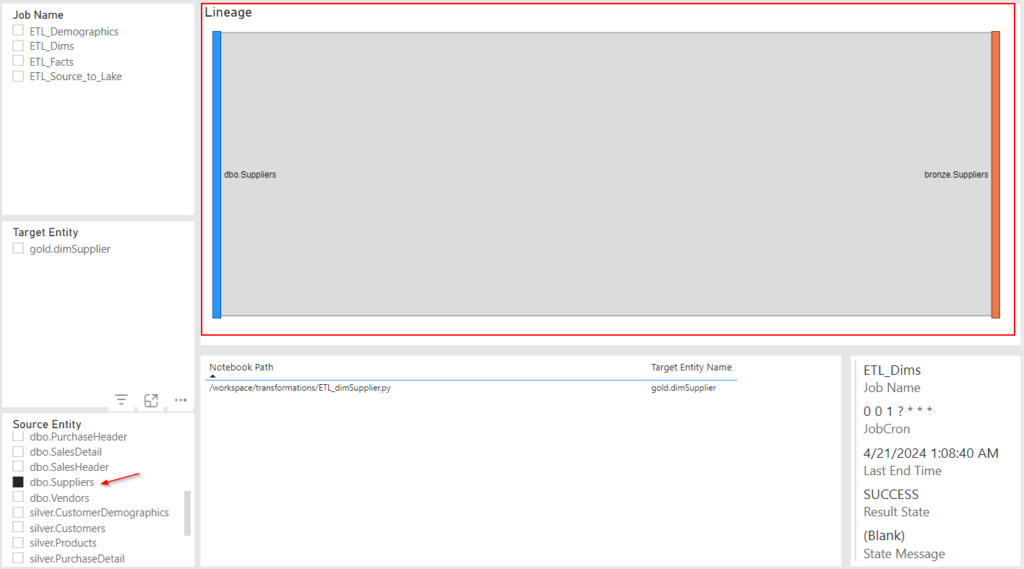
Filter by Source Entity (kind of buggy):
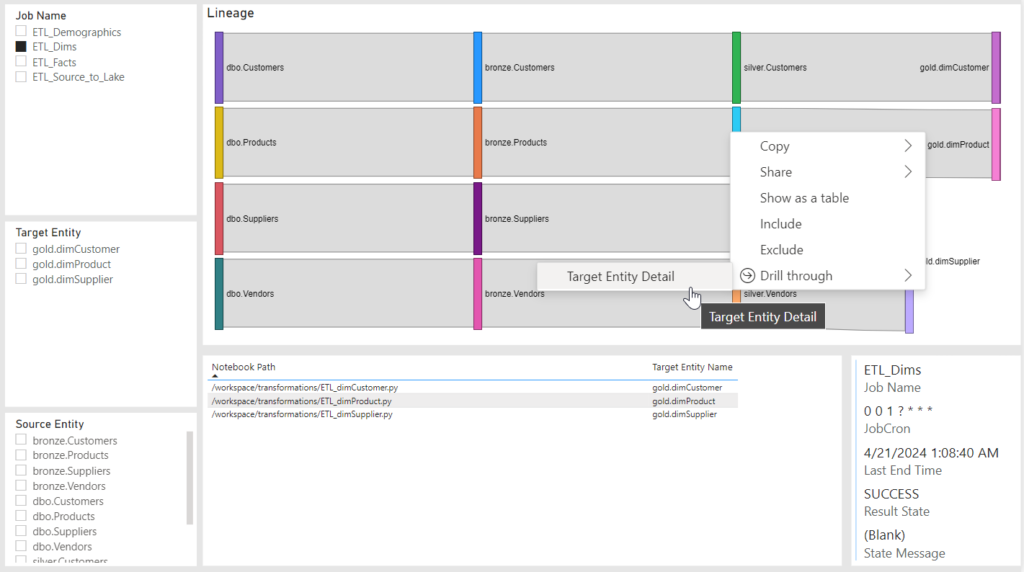
Drill to Target Details:
I’ve added the both the database that was used in this sample as well as the Power BI to download to my github for you to download and get some ideas from.
So there you have it; The Poor Man’s Data Lineage! I hope you get some ideas and start playing with Sankey charts in this manner or for other purposes.