
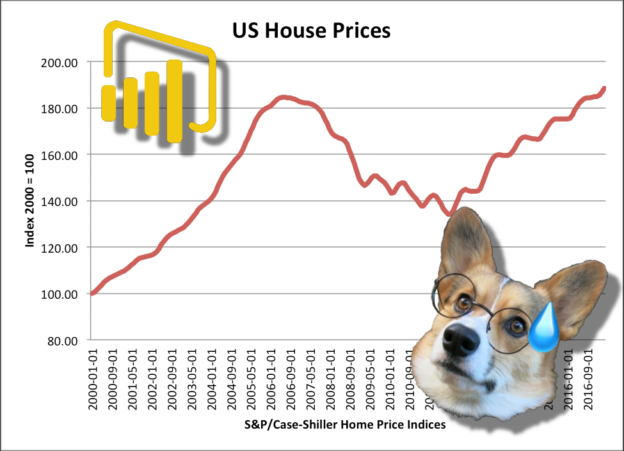
Two years ago I got tired of paying rent and decided to dive into homeownership because of the insights I saw in a similar dashboard to the one in this post. What I saw was purchasing a home in Englewood was a sound investment because it was a neutral to almost a buyer’s market in the southern part. I bet on the southern expansion of Broadway as people found living in Platt Park/Wash Park became more and more unaffordable as well as local investments in the betterment and appeal of Englewood driving northern expansion along Broadway.
It’s inevitable that the South Broadway strip will eventually become more walkable and different than the times of even a decade ago, where it was void of any stores worth visiting and restaurants that were any good; and that’s exactly what the data was showing me. Now I’m here two years later, engaged, and wanting to purchase another home. What will the data show this time?
If you’ve purchased a home recently, you probably got access to a real estate matrix site. Not only do these sites help you find a home easier based on the criteria you give your agent, but they contain a wealth of data ready for scraping. I wasn’t interested in scraping everything or writing a beautifulsoup program to do so programmatically, so I resorted to doing things the good ole fashion way, copying and pasting.
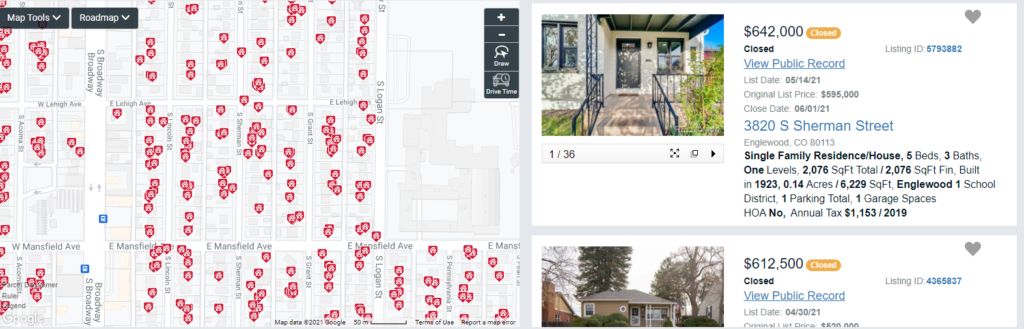
My criteria was simple, any home under 700k sold since January 1st, 2020. This would give me a good idea of what was happening in different sections of the south Denver metro area.
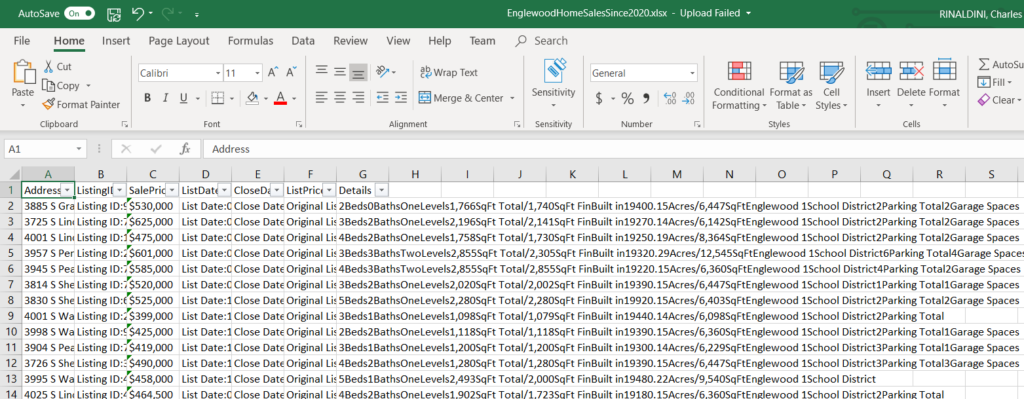
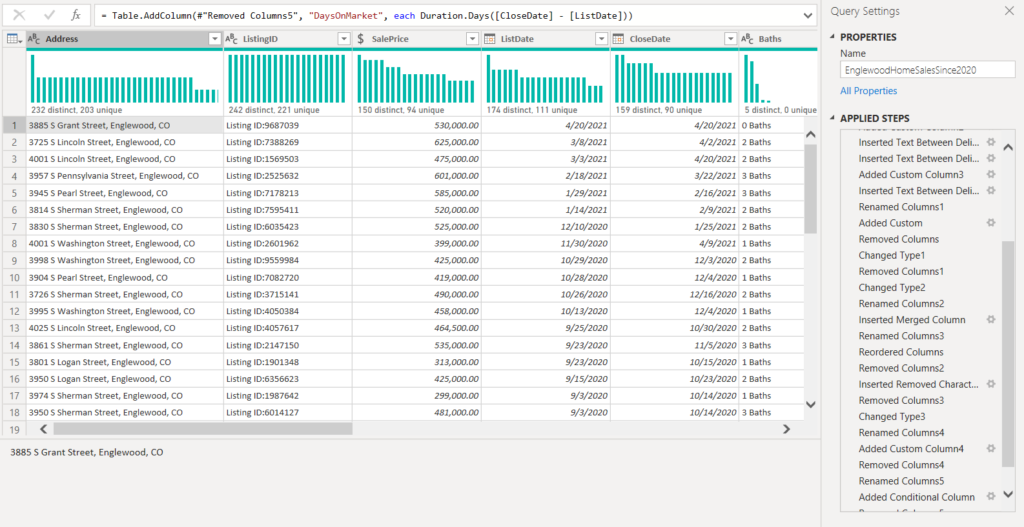
Once I had this data from Excel imported into Power BI, I mostly used the column by example feature to break out and further clean the data into data points that I found interesting or would influence my purchase. I also added some derived columns that would give me things such as Days on Market and List to Sales Price Difference.
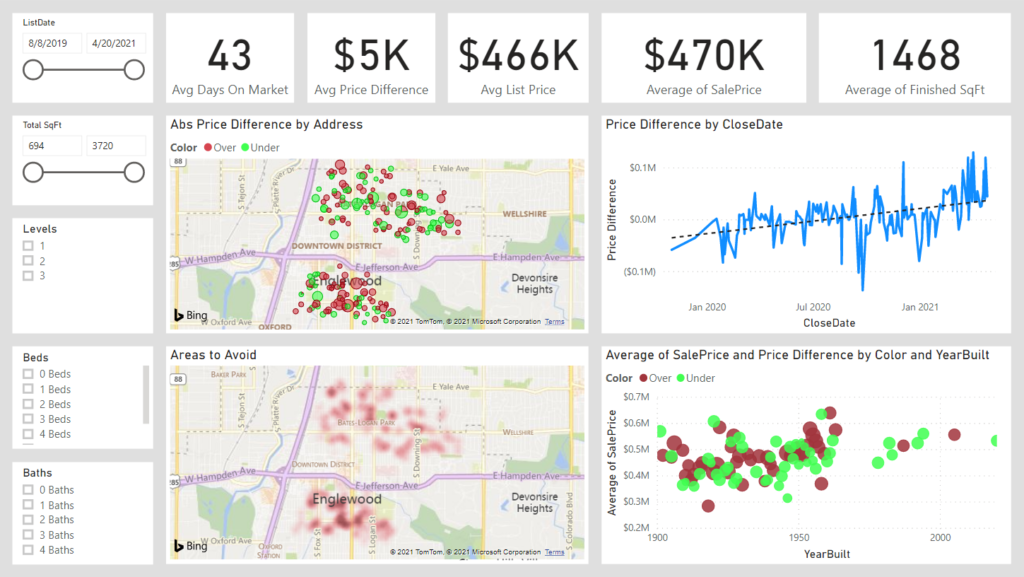
From here I decided to make a dashboard where I could filter based on location and attributes of a house. The most insightful pieces of the dashboard were obviously 1) house prices are continuing to rise, 2) I shouldn’t buy in my current location, and 3) moving a bit North East would probably be the best move.
Knowing all of this we focused our search outside of our current neighborhood and knew how much over asking was too much over asking to be worth our trouble. We ended up finding a nice ranch home right outside of Englewood and actually got it under list price.
It just goes to show that with the right insights you might not be at a complete loss when competing in this market!