Delta tables are Databricks’ method of choice when storing data in the Lakehouse. They are useful when needing to persist dataframes to disc for speed, later use, or to apply updates. In some cases you need to track how often a Delta table is updated outside of Databricks.
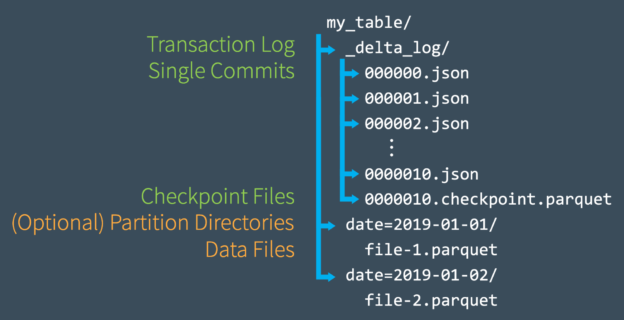
If you look under the covers of a Delta table, it is made up of numerous parquet files, various json files, as well as some other files to track the current state and historical states. The number of json files is determined by the number of operations done to a Delta table within the retention threshold. The action of removing old files is known as a “vacuum” and can be read about here. Since the history of all actions aren’t stored indefinitely, you may want to capture these values and store them elsewhere.
Recently there has been an ask of my team to dashboard the throughput and latency of some of our Delta tables that are “streamed” to by a third-party software. This software can perform hundreds or even thousands of updates to a Delta table a day and does not store its latency or throughput information anywhere accessible. Luckily this is where the Delta table _delta_log comes in handy!
The _delta_log is a folder that is created with all Delta tables and is used as a transaction log to keep track of the table’s state. When an operation is conducted upon the Delta table, a new parquet file or multiple parquet files are created an an incrementing numbered json file is added to the _delta_log. Each operation can have a different formatted json object, so it is important to only go after the ones that are useful to us… but how?
I knew the answer to our question of monitoring our Delta table’s performance laid within these json files, but I could not find much about how to access them anywhere on the internet. Thus, I am writing this blog post in hopes it will help someone with the same problem.
If you’ve read some of the earlier blog posts on this site, you will know that I wrote up an extensive guide on how to expose files stored in a lakehouse through Synapse views in order to interact with them in a Polybase-like manner. Here we build upon that principle and access the _delta_log using that mechanism.
Like I mentioned before, there are various formats of json in the _delta_log folder. Because of that we want to access them in a generic manner then filter down the contents of each object to the ones we are interested in. For us, that was the objects with the “commitInfo” object, excluding commit operations that were of the “OPTIMIZE” type. You can see in the following T-SQL how this is accomplished:
create or alter view audit.deltaTable_delta_log
as
select json_value(commitInfo, ‘$.timestamp’) as operationEpoch
, dateadd(second, cast(json_value(commitInfo, ‘$.timestamp’) as decimal(38,0))/1000, ‘19700101’) as operationTimestamp
, json_value(commitInfo, ‘$.operation’) as operation
, json_value(commitInfo, ‘$.readVersion‘) as readVersion
, json_value(commitInfo, ‘$.operationMetrics.numFiles‘) as numFiles
, json_value(commitInfo, ‘$.operationMetrics.numOutputRows‘) as numOutputRows
, json_value(commitInfo, ‘$.operationMetrics.numOutputBytes‘) as numOutputBytes
from (
select json_query(doc,‘$.commitInfo‘) as commitInfo
from openrowset (
bulk ‘deltaTable/_delta_log/*.json‘,
data_source = ‘adls_silver‘,
format = ‘csv’,
fieldterminator =‘0x0b’,
fieldquote = ‘0x0b’
)
with (doc nvarchar(max)) as rows
where json_query(doc,‘$.commitInfo‘) is not null
) commits
where json_value(commitInfo, ‘$.operation’) != ‘OPTIMIZE’
As you can see above, there is a specific way to read multiple json files with a wildcard as if they were csv files. Thankfully, this part is actually documented by Microsoft here. After reading in the json files, we can then look for specific elements in the files to filter out the ones that do not contain commit information, as well as filtering out optimize commands. What we are left with is the the information we are after. I’ve even included the logic to convert the epoch that is used to track the time at which the commit happened, to a datetime. The only thing that this query is lacking is the version number (which I believe is just one more than the readVersion) that is the actual json file name.
From here you can access this view via a Linked Server and merge its results into a table that stores the historical version of each commit file. We use the operationEpoch as the primary key of these tables.

